Special Paths
These are the methods for creating and using various special paths including contours, splines, steps, arrows, and error bars.
FigureMaker methods
append_interpolant_to_path(interp) [ doc ]
Append a series of Bezier curves to the path based on the
cubic spline interpolant `interp`.  See `make_interpolant()`.
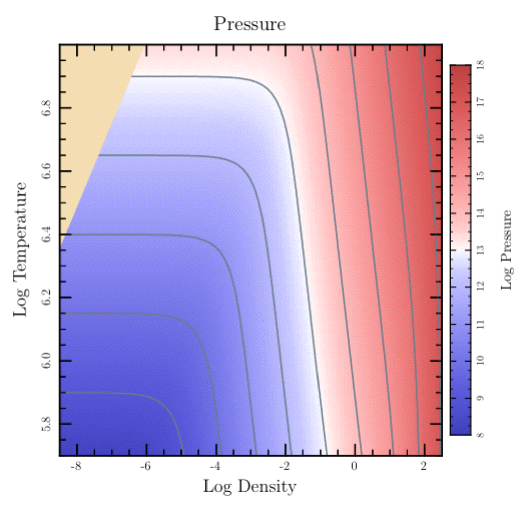
make_contour(data, x, y, gap, zlevel, legit=None, method=gri) [ doc | example ]
Make contours

INPUTS

  data    -- The data table
  x       -- The x figure coordinates for the columns of `data`
  y       -- The y figure coordinates for the rows of `data`
  gaps    -- Indices for gaps will be placed in this Array
  zlevel  -- The contour level
  legit   -- Optional table, same size as `data`, non-zero means
             corresponding element in `data` is okay
  method  -- 'conrec' or 'gri' (default)

Creates a path following a contour in a two dimensional table
of data using an algorithm from Gri
(http://gri.sourceforge.net/) done by Dan Kelley or the CONREC
(http://local.wasp.uwa.edu.au/~pbourke/papers/conrec/)
algorithm of Paul D. Bourke.  The results are returned in
2-element array with first element a vector of the x values
for the contour and second element a vector of the y values.
See `show_contour()`.
Example
TODO: update with the python-version of code snippet.
levels = [9,10,11,12,13,14,15,16,17]
t.show_plot('boundaries' => bounds) do
clip_press_image
t.stroke_color = SlateGray
t.line_width = 1
dict = { 'gaps' => gaps, 'xs' => @eos_logRHOs, 'ys' => @eos_logTs, 'data' => @pres_data }
levels.each do |level|
dict['level'] = level
pts_array = t.make_contour(dict)
t.append_points_with_gaps_to_path(pts_array[0], pts_array[1], gaps, true)
t.stroke
end
end
make_interpolant(x, y) [ doc | example ]
Make a cubic spline interpolant

INPUTS

  x      -- the data x in figure coordinates
  y      -- the data y in figure coordinates

A cubic spline interpolantis created using the points
specified in `x` and `y` and scipy.interpolate.splrep.  The
returned tuple is passed directly to
`append_interpolant_to_path()` as an argument.
Example
TODO: update with the code snippet below converted into Python.
Example

def splines # append bezier curves
t.do_box_labels("Splines", "Position", "Average Count")
xs = Dvector[ 1.0, 2.0, 5.0, 6.0, 7.0, 8.0, 10.0, 13.0, 17.0 ]
ys = Dvector[ 3.0, 3.7, 3.9, 4.2, 5.7, 6.6,  7.1,  6.7,  4.5 ]
t.show_plot('boundaries' => [-1, 19, 8, 2]) do
t.fill_color = FloralWhite
t.fill_frame
start_slope = 2.5*(ys[1]-ys[0])/(xs[1]-xs[0])
interp = t.make_interpolant('xs' => xs, 'ys' => ys,
'start_slope' => start_slope)
t.append_interpolant_to_path(interp)
t.stroke_color = Black
t.stroke
t.show_marker('Xs' => xs, 'Ys' => ys,
'marker' => Bullet, 'scale' => 0.6, 'color' => Red);
end
end

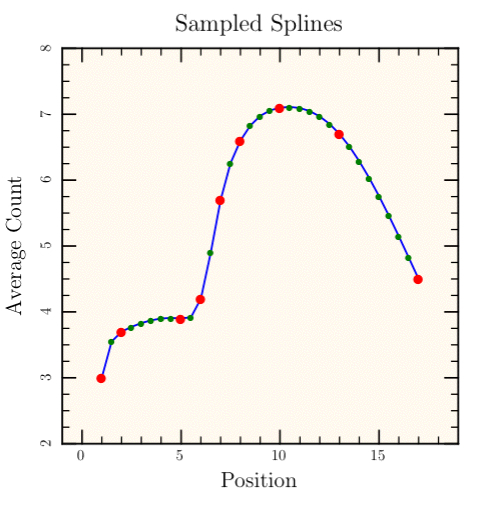
make_spline_interpolated_points(x, y, xsample, start_slope=None, end_slope=None) [ doc | example ]
Creates an interpolated series of points

INPUTS

  x       -- The data x in figure coordinates
  y       -- The data y in figure coordinates
  xsample -- The x values where will interpolate
  start_slope
          -- defaults to None
  end_slope
          -- defaults to None

Creates an interpolated series of points smoothly connecting
the given data points.  See also
`append_interpolant_to_path()` for creating smooth paths based
on Bezier curves rather than on sampled points joined by
straight line segments.  Returns a vector of the y values
corresponding to the requested `xsample`.

A cubic spline interpolant is created (see
`make_interpolant()`) using `start_slope`, `end_slope`, `x`,
and `y`.  At each x location in `xsample`, the interpolant is
used to find the corresponding y location which is then
returned as the value.  The results can passed to routines
such as `append_points_to_path()` or `show_polyline()`.
Example
TODO: update with a code snippet.
def sampled_splines
t.do_box_labels("Sampled Splines", "Position", "Average Count")
xs = Dvector[ 1.0, 2.0, 5.0, 6.0, 7.0, 8.0, 10.0, 13.0, 17.0 ]
ys = Dvector[ 3.0, 3.7, 3.9, 4.2, 5.7, 6.6,  7.1,  6.7,  4.5 ]
data_pts = xs.size
x_first = 0.0; x_last = 18.0; y_first = y_last = 2.5
x_results = Dvector[]
y_results = Dvector[]
t.make_steps(
'dest_xs' => x_results, 'dest_ys' => y_results,
'xs' => xs, 'ys' => ys,
'x_first' => x_first, 'y_first' => y_first,
'x_last' => x_last, 'y_last' => y_last)
t.show_plot('boundaries' => [-1, 19, 8, 2]) do
t.fill_color = FloralWhite
t.fill_frame
smooth_pts = 4*(data_pts-1) + 1
dx = (xs[data_pts-1] - xs[0])/(smooth_pts-1)
sample_xs = Dvector.new(smooth_pts) { |i| i*dx + xs[0] }
result_ys = t.make_spline_interpolated_points(
'sample_xs' => sample_xs, 'xs' => xs, 'ys' => ys,
'start_slope' => 2.5*(ys[1]-ys[0])/(xs[1]-xs[0]))
t.stroke_color = Blue
t.append_points_to_path(sample_xs, result_ys)
t.stroke
t.show_marker('Xs' => sample_xs, 'Ys' => result_ys,
'marker' => Bullet, 'scale' => 0.4, 'color' => Green);
t.show_marker('Xs' => xs, 'Ys' => ys,
'marker' => Bullet, 'scale' => 0.6, 'color' => Red);
end
end
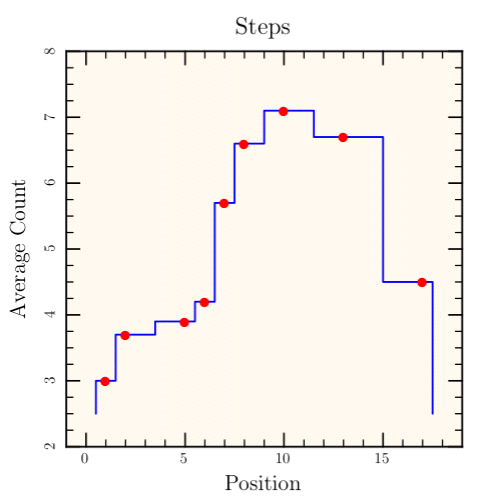
make_steps(x, y, xfirst=None, yfirst=None, xlast=None, ylast=None, justification=None) [ doc | example ]
Create a staircase path with steps for the given points

INPUTS

  x       -- x points in figure coordinates
  y       -- y points in figure coordinates

OPTIONAL INPUTS

  xfirst  -- x location for the start of the steps; defaults to
             the first element of x
  yfirst  -- y location for the start of the steps; defaults to
             the first element of y
  xlast   -- x location for the end of the steps; defaults to
             the last element of x
  ylast   -- y location for the end of the steps; defaults to
             the last element of y
  justification
          -- see below; defaults to Centered

Returns 2-element array with first element a 1D array of the x
values for the steps and second element a 1D array of the y
values.

The widths of steps are determined by `xfirst`, `x`, and
`xlast`; the heights of steps are determined by `yfirst`, `y`,
and `ylast`.  The argument `justification` specifies where the
step (i.e., change in y value) occurs.  For Centered, the
steps occur at the midpoints between the given `x` locations.
For Left (Right), the `x` and `y` pairs specifies the left
(right) edges of the steps.
Example
TODO: update with a code snippet.
show_arrow(xhead, yhead, xtail, ytail, line_width=1.0, line_type=None, head_marker=(14, 228), tail_marker=(14, 120), head_angle=0.0, tail_angle=-180.0, head_just=None, tail_just=None, head_scale=None, tail_scale=None, color=(0, 0, 0), head_color=None, tail_color=None, line_color=None) [ doc | example ]
Draw an arrow

INPUTS

  xhead   -- x coordinate of the head of the arrow
  yhead   -- y coordinate of the head of the arrow
  xtail   -- x coordinate of the tail of the arrow
  ytail   -- y coordinate of the tail of the arrow
  line_width
  line_type
          -- for the line joining head to tail
  head_marker
          -- default is Arrowhead (use None to omit)
  tail_marker
          -- default is BarThin (use None to omit)
  head_angle
          -- defaults to 0 degree
  tail_angle
          -- defaults to -180 degrees
  head_just
          -- if None, automatically chosen
  tail_just
          -- if None, automatically chosen
  head_scale
          -- scale for `head_marker`
  tail_scale
          -- scale for `tail_marker`
  color
          -- default color for head, line, and tail (deafult: Black)
  head_color
          -- color for `show_marker()` with `head_marker`
  tail_color
          -- color for `show_marker()` with `tail_marker`
  line_color
          -- color for line from head to tail

Draws an arrow connecting the given head and tail points and
optionally adds head and tail markers rotated to match the
slope of the line.
Example
TODO: update with a code snippet.
def show_arrows
t.stroke_rect(0,0,1,1)
center_x = 0.5; center_y = 0.5; len = 0.45
hls = t.rgb_to_hls(Red)
angles = 36
delta = 360.0/angles
angles.times do |angle|
angle *= delta
dx = len*cos(angle*RADIANS_PER_DEGREE)
dy = len*sin(angle*RADIANS_PER_DEGREE)
x = center_x + dx; y = center_y + dy
clr = t.hls_to_rgb([angle, hls[1], hls[2]])
t.show_arrow(
'head' => [x,y],
'tail'=> [center_x, center_y],
'head_scale' => 1.5,
'tail_marker' => 'None',
'head_color' => clr)
end
end

show_contour(x, y, gap=None, color=None, type=None, legend=None) [ doc ]
NOT IMPLEMENTED YET

Calls show_polyline with the close_subpaths argument set to
+false+.  See make_contour.

Note: If you zoom in on a contour line, you'll discover that
it is made up of lots of very short, disconnected line
segments.  This may be a bug in the implementation, or it may
be inherent in the algorithm.  I don't know which.  It only
becomes a problem if you try to use dashes or dots to stroke
the contour line.  The sequence of dashes and dots restarts at
each section of the stroked line, so. for contours, it is
constantly restarting and never getting very far.  The result
is definitely NOT what you'd expect.

Rather than using dots and dashes for contours, you might
consider using different colors and line widths.  For example,
you might make every N'th contour line thicker and darker to
emphasize it.
show_error_bars(x, y, dy=None, dx=None, xlow=None, xhigh=None, ylow=None, yhigh=None, color=(0, 0, 0), end_cap=0.15, line_width=1, _skip_log_check=False) [ doc ]
Draw error bars at given point(s)

INPUTS

  x       -- x coordinate of the point
  y       -- y coordinate of the point

OPTIONAL INPUTS

  dy      -- vertical error bar from y - dy to y + dy
  dx      -- horizontal error bar from x - dx to x + dx
  yhigh   -- vertical error bar from y to yhigh
  ylow    -- vertical error bar from ylow to y
  xhigh   -- horizontal error bar from x to xhigh
  xlow    -- horizontal error bar from xlow to x
  color   -- line color; defaults to Black
  end_cap -- length in text heights (default is 0.15)
  line_width
          -- default is 1

The horizontal extent is given by `dx` or by `xhigh` and
`xlow` in case they are different.  Similarly, the vertical
extent is either `dy` or `yhigh` and `ylow`.  The `end_cap`
parameter specifies the length of end caps on the error bars
in units of the text height.
show_polyline(x, y, type=None, color=None, gap=None, close_subpath=None, legend=None, _skip_log_check=False) [ doc ]
Calls `context()`, then, inside the new context, changes
`self.line_type` and `self.stroke_color` (if `color` and
`type` are not None), calls
`append_points_with_gaps_to_path()`, calls `stroke()`, and
then saves the legend information (if `legend` is not None).
FigureMaker attributes
PyTioga version: alpha (20071021)
Copyright (C) 2007 Taro Sato & Bill Paxton. All rights reserved.