Figures and Plots
FigureMaker methods
context(cmd, cmd_args=()) [ doc ]
Save the state before and restore after executing `cmd(t)`

INPUT

  cmd     -- a function or method which makes a plot

The context routine saves 'state', executes the given block,
and then restores state.  The state being saved and restored
consists of the attributes defining the page setup (frame,
bounds, axes), graphics (clip region, stroke and fill colors,
line width and type, etc.), axis label settings, and legend
layout settings.  Some of the things it saves and restores are
arrays (such as the optional arrays of locations for major
tick marks on the axes).  In these cases, context will save
and restore the pointer to the array, but it doesn't do
anything about the contents of the array.  Similarly, for text
strings such as the title, it will save and restore the
pointer but not the contents.

Among the things that it does *not* save/restore is the saved
legend information (as opposed to the legend layout attributes
which are saved).  This makes it possible to gather legend
information from a subplot while still isolating it in its own
context.

Routines such as `show_plot()`, `subplot()`, and `subfigure()`
make use of context to prevent side-effects from the execution
of the code body 'leaking' out to pollute the caller's
environment.  The practical result is that in writing plotting
routines, you can safely change various settings without
needing to restore the old values when you finish.  This
becomes critical when you begin to combine several plots into
a composite plot.
doing_subfigure() [ doc ]
Sets the `self.root_figure` flag to False.  Is called on entry
to the `subfigure()` routine.  Provided as a convience for
your plotting routines.
doing_subplot() [ doc ]
Sets the `self.in_subplot` flag to True.  Is called on entry
to the `subplot()` routine.  Provided as a convience for your
plotting routines.
rescale(factor) [ doc ]
Calls both `rescale_text()` and `rescale_lines()` with the
given `factor`.
show_edges() [ doc ]
Makes a series of calls to show the frame edges
(`show_top_edge()`, `show_left_edge()`, etc.)
show_plot(cmd, left=0.0, right=0.0, top=0.0, bottom=0.0) [ doc ]
Show a plot

INPUTS

  cmd     -- a function or method which makes a plot
  left    -- left bound
  right   -- right bound
  top     -- top bound
  bottom  -- bottom bound

The first action of `show_plot()` is to call `set_bounds()` to
set up the figure coordinates for the plot.  Then, inside a
call to `context()` so that the current state will be restored
later, it calls `clip_to_frame()` followed by the block
defining the plot.  Finally, it calls `show_plot_box()` to
take care of the axes and labels.
show_plot_box() [ doc ]
Makes a series of calls to show the axes, edges, title, and
axis labels.  This routine is called by `show_plot()` after
the contents of the frame have been finished.
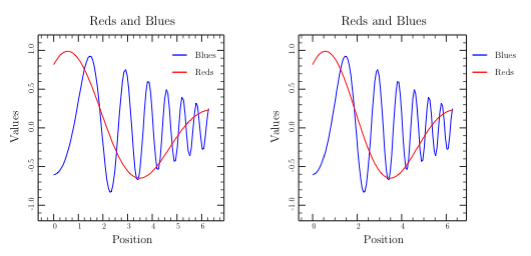
show_plot_with_legend(cmd, legend_left=None, legend_right=None, legend_top=None, legend_bottom=None, legend_scale=None, plot_left=None, plot_right=None, plot_top=None, plot_bottom=None, plot_scale=None) [ doc | example ]
Show plot with legend

INPUTS

  cmd     -- command block
  legend_left
          -- left margin for legend
  legend_right
          -- right margin for legend
  legend_top
          -- top margin for legend
  legend_bottom
          -- bottom margin for legend
  legend_scale
          -- scale for legend
  plot_left
          -- left margin for plot
  plot_right
          -- right margin for plot
  plot_top
          -- top margin for plot
  plot_bottom
          -- bottom margin for plot
  plot_scale
          -- scale for plot

Adjusts margins according to the input argument, executes the
plot definition, then calls `show_legend()`.  The arguments
except `cmd` are all optional, and default values are taken
from the `self.legend_defaults` dict.  The margin sizes are
given as fractions of the current frame.  The `plot_scale`
applies to the entire plot including the legend.  The
`legend_scale` only applies to the legend.
Example
def legend_inside(t):
    read_data(t)
    t.show_plot_with_legend(reds_blues,
                            legend_left=0.65,
                            plot_scale=1,
                            legend_scale=1.3,
                            plot_right=0)


def legend_outside(t):
    read_data(t)
    def cmd(t):
        reds_blues(t)
        t.show_marker([0, 2, 4, 6], [0.2, -0.1, 0.3, -0.5],
                      marker=Circle,
                      scale=0.5,
                      fill_color=Teal,
                      legend='Spots')
    t.show_plot_with_legend(cmd, legend_scale=1.3)


def legends(t):
    read_data(t)
    def cmd(t):
        t.rescale(0.5)
        t.subplot(legend_inside, right=0.6)
        t.subplot(legend_outside, left=0.56)
    t.subfigure(cmd, top=0.6)
subfigure(cmd, left=0.0, right=0.0, top=0.0, bottom=0.0) [ doc ]
Define a subfigure

INPUTS

  cmd     -- command block
  left    -- left margin
  right   -- right margin
  top     -- top margin
  bottom  -- bottom margin

Inside a call to `context()`, `subfigure()` first calls
`doing_subfigure()`, then calls `set_subframe()` with the
margins, and finally executes the `cmd(t)` for the figure.
subplot(cmd, left=0.0, right=0.0, top=0.0, bottom=0.0) [ doc ]
Define a subplot

INPUTS

  cmd     -- command block
  left    -- left margin
  right   -- right margin
  top     -- top margin
  bottom  -- bottom margin

Inside a call to `context(), `subplot()` first calls
`doing_subplot()`, then calls `set_subframe()` with the
margins, and finally executes the `cmd(t)` for the plot.
FigureMaker attributes
in_subplot [ doc ]
Flag starts False and is set to True by the `doing_subplot()`
routine which is called on entry to the `subplot()` routine.
This is simply provided as a convenience for routines that
need to know whether they are being called as a subplot or as
a top-level plot.  Same as not `self.root_plot`.
root_figure [ doc ]
Flag starts True and is set to False by the
`doing_subfigure()` routine which is called on entry to the
`subfigure()` routine.  This is simply provided as a
convenience for routines that need to know whether they are
being called as a subfigure or as a top-level figure.  Same as
not `self.in_subplot`.
in_subfigure [ doc ]
Flag starts False and is set to True by the
`doing_subfigure()` routine which is called on entry to the
`subfigure()` routine.  This is simply provided as a
convenience for routines that need to know whether they are
being called as a subfigure or as a top-level figure.  Same as
not `self.root_figure()`.
root_plot [ doc ]
Flag starts True and is set to False by the `doing_subplot()`
routine which is called on entry to the `subplot()` routine.
This is simply provided as a convenience for routines that
need to know whether they are being called as a subplot or as
a top-level plot.  Same as not 'self.in_subplot`.
PyTioga version: alpha (20071021)
Copyright (C) 2007 Taro Sato & Bill Paxton. All rights reserved.